


You know that feeling when you’re doing the same task for the hundredth time and thinking, “There has to be a better way”? That’s exactly what DevOps automation tools solve.
They take the repetitive, time-consuming work off your plate, building code, testing apps, deploying updates, managing servers, and handling it automatically so your team can focus on what actually matters.
But here’s the challenge: there are tons of tools out there, and picking the wrong ones can waste weeks of setup time and budget.
This guide cuts through the noise. You’ll find a list of the best DevOps automation tools for 2026, organized by what they actually do.
We’ll walk you through quick comparisons, pricing breakdowns, ready-made tool stacks for different team sizes, and a simple checklist to help you choose the right fit.
What Are DevOps Automation Tools?
DevOps automation tools are software platforms that handle repetitive tech tasks for you automatically.
Think of them as your team’s digital assistants; they run the same steps perfectly every single time, without getting tired or making mistakes.
Here’s What These Tools Can Automate:
- Building Code: Compiling your application code and packaging it up so it’s ready to run
- Running Tests: Checking that the new code works correctly before it goes live
- Deploying Updates: Pushing your software to servers or the cloud without manual button-clicking
- Setting up Infrastructure: Creating servers, databases, and networks through code instead of manual setup
- Managing Configurations: Keeping all your systems configured the same way across different environments
- Monitoring and Alerts: Watching your apps 24/7 and letting you know immediately when something breaks
Why Bother with Automation?
Simple: it makes your team faster, more reliable, and way less stressed.
You’ll ship updates in minutes instead of hours, catch bugs before customers do, and stop worrying about that one person who’s the only one who knows how to deploy on Friday afternoons.
Automation brings consistency; the same process runs the same way every time, whether it’s Tuesday morning or Saturday night.
25 Best DevOps Automation Tools Reviewed (2026)
Here’s the complete breakdown of the top DevOps automation tools you can use right now—sorted by what they do best, with honest pricing and real-world pros and cons.
1. Jenkins
- Best for: Teams that need complete control and customization over their CI/CD pipelines
- Price: Free (open-source), but you’ll pay for hosting and maintenance
Jenkins is the Swiss Army knife of automation tools. It’s been around forever and can do just about anything you need, building code, running tests, deploying apps, through thousands of plugins.
You’ll need some technical skills to set it up, but once it’s running, you can automate pretty much any workflow you can imagine. It works with every language and integrates with nearly every tool out there.
| Pros | Cons |
|---|---|
| Completely free and open-source | Steep learning curve for beginners |
| Massive plugin library (1,800+) | Requires dedicated maintenance |
| Works with any tech stack | Outdated UI compared to newer tools |
| Full customization and control | You manage the servers yourself |
2. GitHub Actions
- Best for: Teams already using GitHub who want CI/CD built right into their workflow
- Price: Free for public repos; private repos get 2,000 minutes/month free, then $0.008/minute
GitHub Actions lives right inside your code repository, so you don’t need to jump between tools. You write simple workflow files that tell it what to do whenever code changes, run tests, build containers, deploy to production.
It’s super beginner-friendly with tons of pre-built actions you can use like building blocks. If your code’s already on GitHub, this is often the easiest automation tool to start with.
| Pros | Cons |
|---|---|
| Built directly into GitHub | Can get expensive with heavy usage |
| Easy to learn and set up | Limited to GitHub ecosystem |
| Huge marketplace of ready-made actions | Less flexible than Jenkins |
| No servers to manage | Debugging workflows can be tricky |
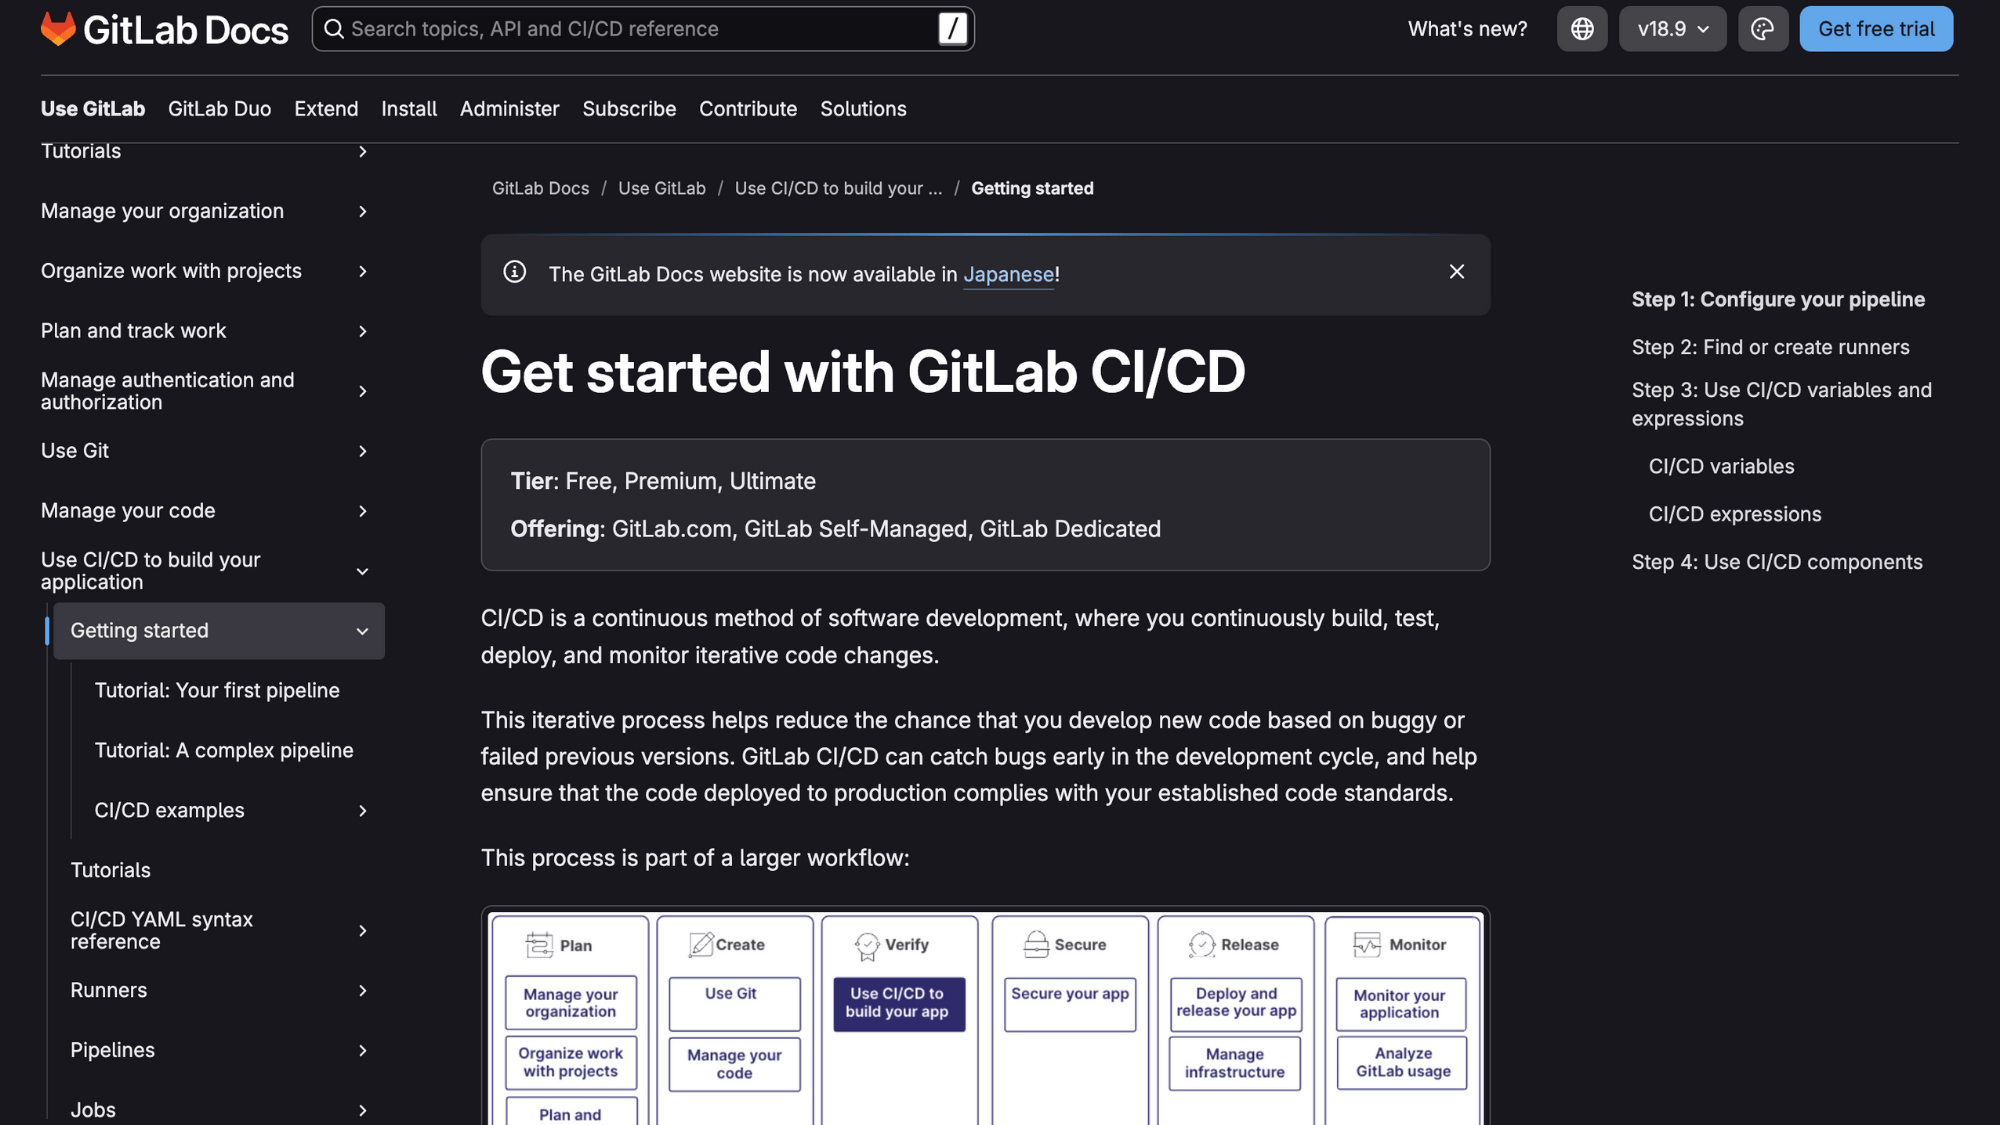
3. GitLab CI/CD
- Best for: Teams wanting an all-in-one platform for code, CI/CD, and deployment in one place
- Price: Free tier available; Premium starts at $29/user/month
GitLab CI/CD gives you everything under one roof, your code repository, automation pipelines, security scanning, and deployment tools all live together.
You define pipelines in a simple YAML file, and GitLab handles the rest. It’s perfect if you’re tired of stitching together five different tools just to get code from your laptop to production.
The integrated approach means fewer logins and less tool-switching throughout your day.
| Pros | Cons |
|---|---|
| Complete DevOps platform in one tool | Can feel overwhelming with so many features |
| Built-in security and compliance scanning | Steeper pricing for advanced features |
| Excellent Kubernetes integration | Self-hosting requires significant resources |
| Auto DevOps for quick starts | Learning curve for the full platform |
4. CircleCI
- Best for: Teams that need fast builds and want a cloud-based solution without server management
- Price: Free tier with 6,000 build minutes/month; paid plans start at $15/month
CircleCI focuses on speed; your builds run fast, and the setup is straightforward. It’s a cloud-native tool, so there’s no infrastructure to babysit.
You connect your GitHub or Bitbucket repo, add a config file, and you’re automating builds and deployments in minutes.
It shines when you need parallel testing (running multiple tests at once) to speed things up even more. Great choice if you want powerful automation without the DevOps overhead.
| Pros | Cons |
|---|---|
| Very fast build times | Free tier limits can be restrictive |
| Zero infrastructure to manage | Pricing jumps quickly as you scale |
| Excellent Docker and Kubernetes support | Less customizable than self-hosted options |
| Smart caching speeds up repeat builds | Fewer integrations than Jenkins |
5. Tekton
- Best for: Kubernetes-native teams building cloud-native pipelines that run entirely on Kubernetes
- Price: Free (open-source), but you need a Kubernetes cluster to run it
Tekton is built specifically for Kubernetes; it runs your pipelines as containers inside your cluster. If you’re already all-in on Kubernetes, this makes total sense because everything lives in the same place.
You define pipelines using Kubernetes-style YAML, and it integrates seamlessly with other cloud-native tools.
It’s more technical than GitHub Actions, but gives you powerful, standardized pipelines that work the same way across any cloud provider.
| Pros | Cons |
|---|---|
| Native Kubernetes integration | Requires Kubernetes knowledge |
| Runs anywhere Kubernetes runs | Steeper learning curve than traditional CI/CD |
| Vendor-neutral and portable | Smaller community than established tools |
| Reusable pipeline components | More setup complexity upfront |
6. Terraform
- Best for: Teams managing infrastructure across multiple cloud providers with code instead of clicking buttons
- Price: Free (open-source); Terraform Cloud has a free tier, paid plans start at $20/user/month
Terraform lets you write your entire infrastructure as code, servers, databases, networks, everything.
You describe what you want in simple configuration files, and Terraform makes it happen across AWS, Azure, Google Cloud, or hundreds of other providers.
The best part? You can version control your infrastructure just like regular code, see exactly what will change before it happens, and destroy everything with one command when you’re done testing.
| Pros | Cons |
|---|---|
| Works with virtually every cloud provider | State file management can be tricky |
| Clear preview of changes before applying | Learning the HCL language takes time |
| Massive community and module library | No built-in secrets management |
| Infrastructure changes are traceable | Debugging can be frustrating for beginners |
7. Pulumi
- Best for: Developers who want to manage infrastructure using real programming languages like Python, TypeScript, or Go
- Price: Free for individuals; Team plans start at $75/user/month
Pulumi does what Terraform does, but lets you use actual programming languages instead of learning a new config syntax.
Write your infrastructure in Python, JavaScript, TypeScript, Go, or C#, whichever your team already knows.
You get all the benefits of real code: loops, functions, testing, and your favorite IDE features. It’s perfect for teams who want infrastructure-as-code without forcing developers to learn yet another language.
| Pros | Cons |
|---|---|
| Use languages your team already knows | Smaller community than Terraform |
| Full programming features (loops, conditionals) | Can be overkill for simple setups |
| Great testing and type-checking support | Team pricing is higher |
| Modern CLI and developer experience | Fewer third-party modules available |
8. AWS CloudFormation
- Best for: Teams fully committed to AWS who want deep integration with every AWS service
- Price: Free (you only pay for the AWS resources you create)
CloudFormation is Amazon’s native infrastructure-as-code tool, and it knows AWS inside and out. Every new AWS feature works with CloudFormation from day one, no waiting for third-party tools to catch up.
You write templates (in JSON or YAML) that describe your AWS resources, and CloudFormation handles creating, updating, and deleting everything in the right order.
If you’re AWS-only, this gives you the tightest integration possible.
| Pros | Cons |
|---|---|
| Perfect AWS integration, nothing gets missed | Only works with AWS |
| No extra cost, it’s free to use | JSON/YAML templates can get verbose |
| First to support new AWS features | Error messages can be cryptic |
| Built-in drift detection | Slower iteration than some alternatives |
9. Spacelift
- Best for: Teams needing governance, policy enforcement, and collaboration features on top of Terraform or OpenTofu
- Price: Starts at $175/month for small teams; enterprise pricing available
Spacelift wraps around Terraform and OpenTofu to add the stuff teams need, but those tools don’t provide approval workflows, policy checks, cost estimates before deployment, and team collaboration features.
It’s like adding guardrails and a management layer to your infrastructure automation.
Perfect for companies where multiple teams manage infrastructure, and you need visibility, compliance, and control without slowing everyone down.
| Pros | Cons |
|---|---|
| Policy-as-code prevents risky changes | Additional cost on top of cloud expenses |
| Great for multi-team collaboration | Overkill for small teams or simple setups |
| Built-in drift detection and remediation | Requires learning Spacelift-specific concepts |
| Cost visibility before applying changes | Vendor lock-in to Spacelift platform |
10. Atlantis
- Best for: Teams wanting Terraform automation through pull requests without paying for commercial tools
- Price: Free (open-source)
Atlantis brings Terraform into your Git workflow by running plans and applies directly from pull requests.
When someone opens a PR with infrastructure changes, Atlantis automatically runs “terraform plan” and posts the results as a comment.
Reviewers see exactly what will change, and once approved, Atlantis applies it, all without leaving GitHub, GitLab, or Bitbucket.
It’s the budget-friendly way to add collaboration and automation to Terraform without expensive platforms.
| Pros | Cons |
|---|---|
| Completely free and open-source | You host and maintain it yourself |
| Smooth Git-based workflow | Limited compared to commercial alternatives |
| Works with GitHub, GitLab, Bitbucket | Basic UI and reporting |
| Easy for teams already using Terraform | Requires server setup and configuration |
11. Ansible
- Best for: Teams needing simple, agentless automation for configuring servers and deploying applications across any infrastructure
- Price: Free (open-source); Red Hat Ansible Automation Platform starts at $5,000/year for 100 nodes
Ansible automates server setup and configuration using simple, readable YAML files called playbooks. No agents to install on your servers; it just connects over SSH and does the work.
You can configure hundreds of servers the same way in minutes, deploy applications, manage users, install packages, whatever you need.
It’s beginner-friendly compared to other configuration tools, and there are thousands of pre-built modules for common tasks, so you’re not starting from scratch.
| Pros | Cons |
|---|---|
| No agents required, works over SSH | Can be slower than agent-based tools |
| Easy-to-read YAML syntax | Less sophisticated than Puppet for complex configs |
| Huge library of pre-built modules | Sequential execution can bottleneck large deployments |
| Works on Linux, Windows, network devices | Limited built-in reporting and auditing |
12. Puppet
- Best for: Large enterprises needing powerful, model-driven configuration management with strong compliance and reporting
- Price: Free (open-source Puppet); Puppet Enterprise starts around $100/node/year
Puppet is the heavyweight champion of configuration management.
You define the desired state of your infrastructure, and Puppet continuously enforces it, if something drifts from the desired config, Puppet fixes it automatically. It uses agents on every server that check in regularly.
The learning curve is steeper than Ansible, but you get enterprise-grade compliance reporting, role-based access control, and the ability to manage thousands of nodes with detailed visibility into every change.
| Pros | Cons |
|---|---|
| Powerful continuous enforcement of the desired state | Steeper learning curve—proprietary language (Puppet DSL) |
| Excellent for large-scale enterprise environments | Requires agents on all managed systems |
| Strong compliance and audit reporting | More complex setup and maintenance |
| Mature ecosystem and enterprise support | Can feel heavy for smaller teams |
13. Chef
- Best for: Infrastructure teams comfortable with Ruby who need test-driven infrastructure automation
- Price: Free (open-source); Chef Enterprise starts around $137/node/year
Chef treats infrastructure like code in the truest sense; you write “recipes” and “cookbooks” in Ruby to define how systems should be configured.
It’s built for programmers who want the full power of a programming language for infrastructure automation. Chef runs agents on servers and enforces configurations continuously.
You can test your infrastructure code before deploying it, version control everything, and catch configuration problems before they hit production servers.
| Pros | Cons |
|---|---|
| Full Ruby programming power for complex logic | Must know Ruby, high barrier to entry |
| Strong testing framework for infrastructure | Requires agents and a complex setup |
| Excellent for treating infrastructure as real code | Smaller community than Ansible |
| Version control and collaboration-friendly | Heavyweight for simple configuration tasks |
14. Docker
- Best for: Teams wanting to package applications with all their dependencies into portable, lightweight containers
- Price: Free for personal use; Docker Business starts at $24/user/month
Docker changed how we deploy software. It packages your application and everything it needs, code, libraries, and settings, into a container that runs the same way everywhere. No more “it works on my machine” problems.
Containers start in seconds, use way less resources than virtual machines, and make it dead simple to run the same app on your laptop, testing servers, and production without any surprises.
It’s become the standard way to package and ship modern applications.
| Pros | Cons |
|---|---|
| Consistent environments everywhere | Licensing changes caused community concerns |
| Fast startup, containers launch in seconds | Security requires careful image management |
| Much lighter than virtual machines | Persistent data storage needs planning |
| Huge ecosystem of pre-built images | Not ideal for traditional desktop applications |
15. Kubernetes
- Best for: Teams running containerized applications at scale and needing automated deployment, scaling, and management
- Price: Free (open-source); managed Kubernetes services vary by cloud provider
Kubernetes (K8s) is the operating system for containerized applications.
It automatically decides which servers run your containers, restarts them if they crash, scales them up when traffic increases, and handles updates without downtime.
It’s complex, there’s no sugar-coating that, but it solves the problem of running hundreds or thousands of containers reliably. Once you learn it, you can run the same setup on any cloud or your own servers.
| Pros | Cons |
|---|---|
| Industry standard for container orchestration | Very steep learning curve |
| Automatic scaling and self-healing | Significant complexity, overkill for simple apps |
| Works the same everywhere (cloud-agnostic) | Requires dedicated expertise to manage well |
| Massive ecosystem and community support | Resource overhead needs careful tuning |
16. Helm
- Best for: Teams using Kubernetes who want to package and deploy applications with reusable, templated configurations
- Price: Free (open-source)
Helm is the package manager for Kubernetes; think of it like an app store for your cluster.
Instead of writing hundreds of lines of Kubernetes YAML for every application, you use Helm charts (pre-packaged templates) that handle all the complexity. Installing a database or monitoring tool becomes a one-line command.
You can customize charts for different environments (dev, staging, production) without duplicating all that configuration. It makes Kubernetes way more manageable and shareable across teams.
| Pros | Cons |
|---|---|
| Simplifies complex Kubernetes deployments | Still requires Kubernetes knowledge |
| Huge library of ready-to-use charts | Chart quality varies—some are outdated |
| Easy rollbacks to previous versions | Templating can get messy for complex apps |
| Shareable packages across teams and projects | Debugging template errors is frustrating |
17. Argo CD
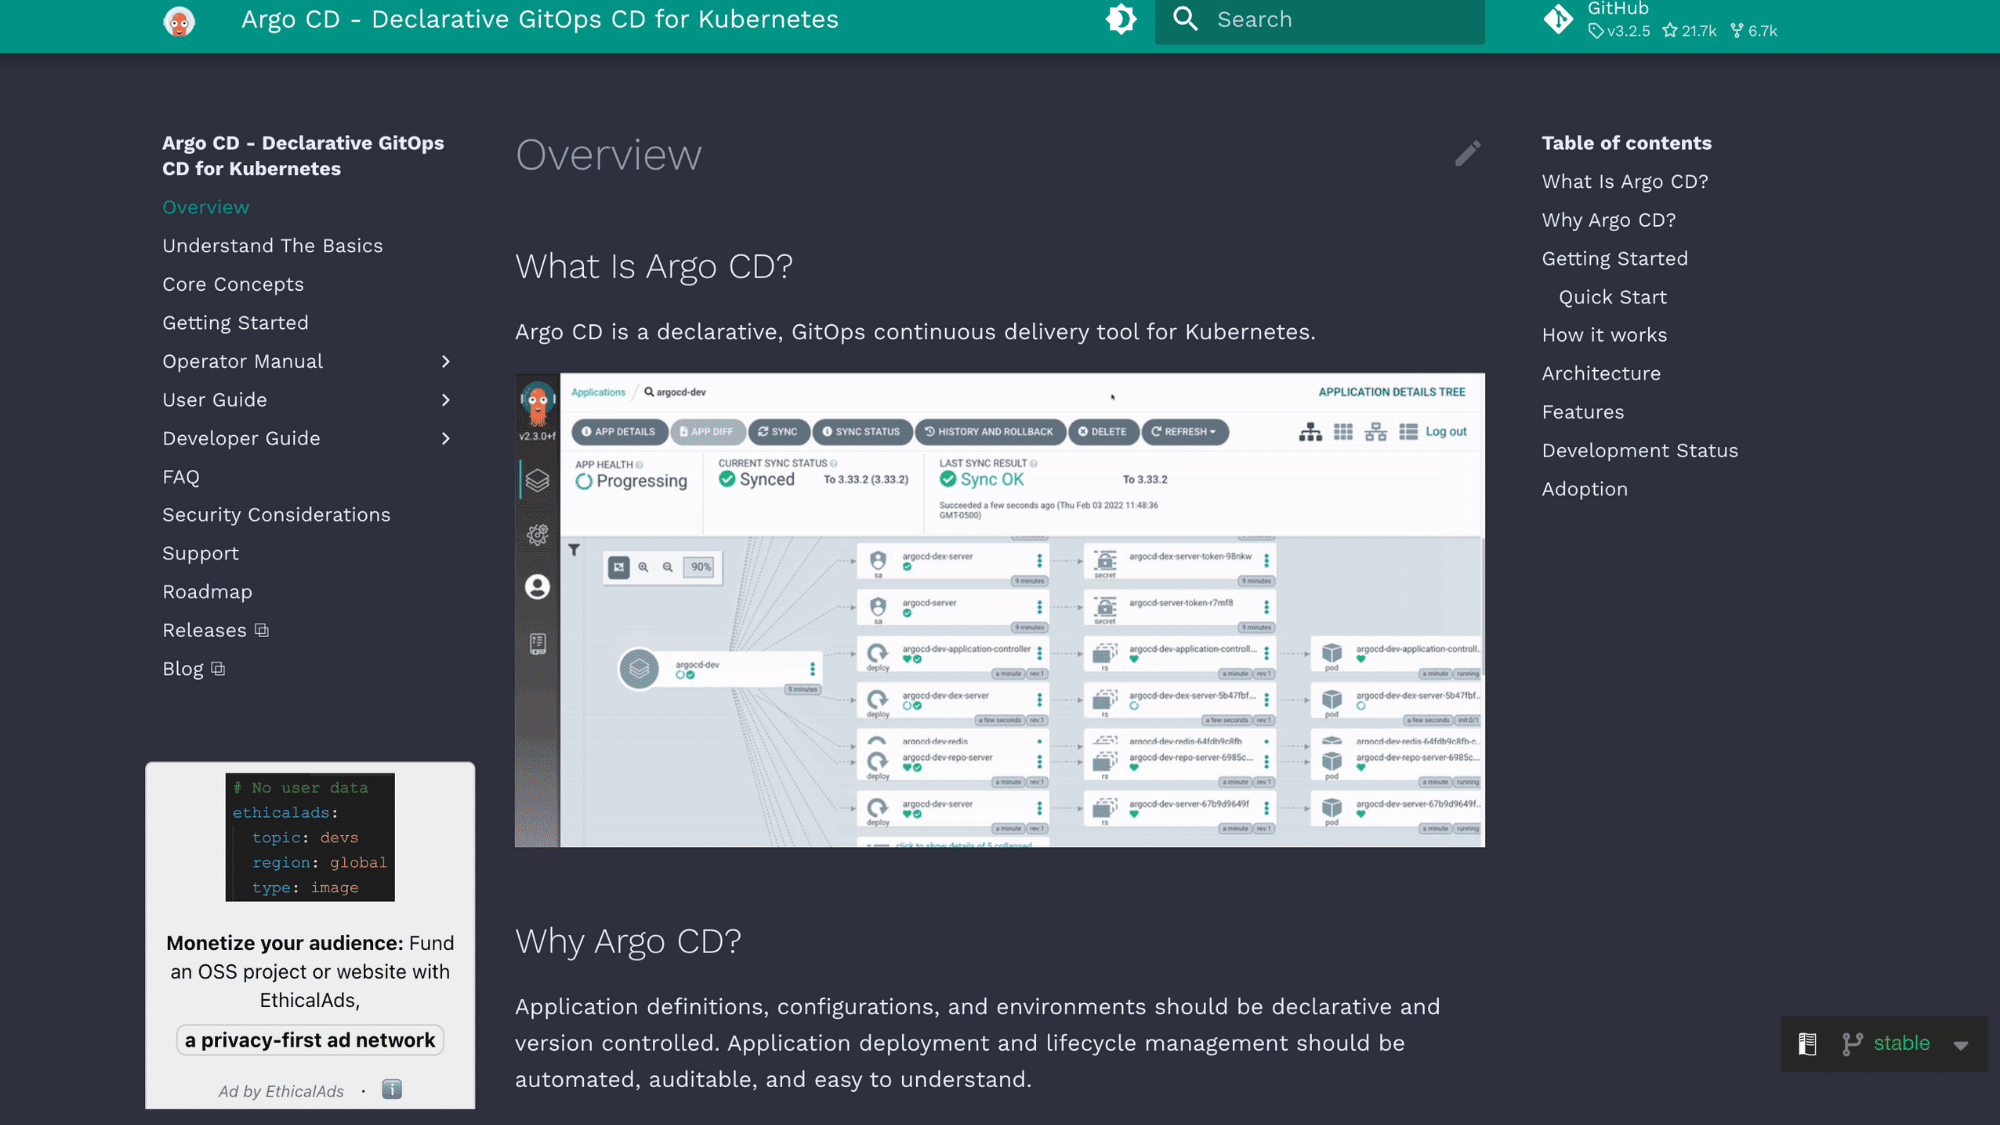
- Best for: Teams practicing GitOps, where your Git repository is the single source of truth for Kubernetes deployments
- Price: Free (open-source)
Argo CD watches your Git repository and automatically keeps your Kubernetes cluster in sync with whatever’s in Git. Change a config file, commit it, and Argo CD deploys it, no manual kubectl commands needed.
It shows you exactly what’s running versus what should be running and can auto-sync or require approvals.
This GitOps approach means your entire deployment history lives in Git, making rollbacks and audits simple. Perfect for teams who want declarative, version-controlled deployments.
| Pros | Cons |
|---|---|
| Git becomes your deployment control center | Kubernetes-only—doesn’t work outside K8s |
| Clear visualization of deployment status | Initial setup and concepts take time |
| Automatic drift detection and correction | Requires changing your deployment workflow |
| Multi-cluster support from one interface | Limited without understanding GitOps principles |
18. Prometheus
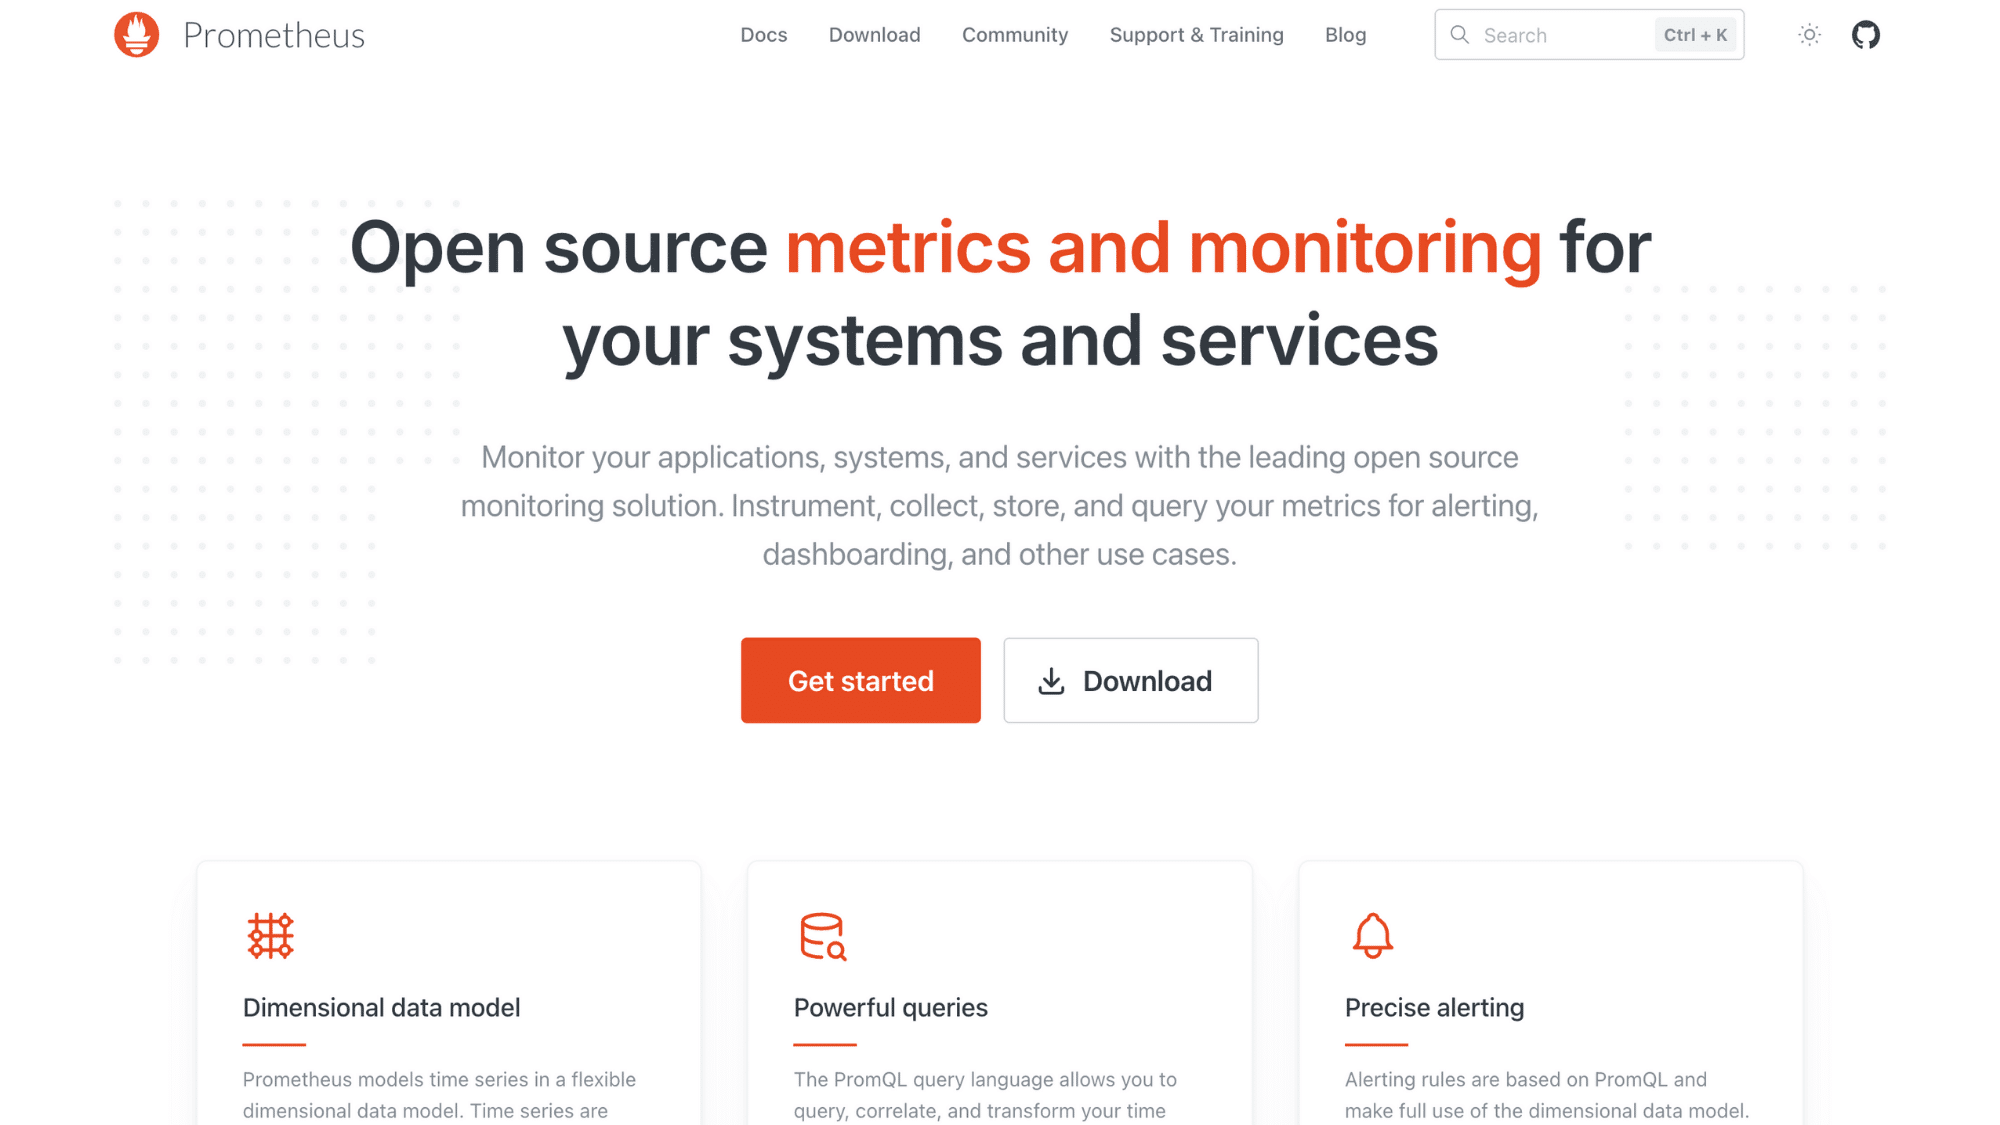
- Best for: Teams needing powerful, open-source monitoring and alerting for cloud-native and containerized environments
- Price: Free (open-source); hosting and storage costs vary
Prometheus collects metrics from your applications and infrastructure automatically, stores them efficiently, and lets you query them with a flexible language.
It’s built for modern, dynamic environments where servers and containers come and go constantly.
Set up alerts based on any metric, CPU usage, error rates, response times, and Prometheus will notify you when things go wrong.
It’s the monitoring backbone for most Kubernetes setups and integrates with just about everything.
| Pros | Cons |
|---|---|
| Purpose-built for cloud-native monitoring | Not designed for long-term metric storage |
| Powerful query language for deep analysis | Learning the PromQL query language takes effort |
| Automatic service discovery in dynamic environments | Scaling requires additional tools (Thanos, Cortex) |
| Completely free with a huge community | Basic UI, usually paired with Grafana for dashboards |
19. Grafana
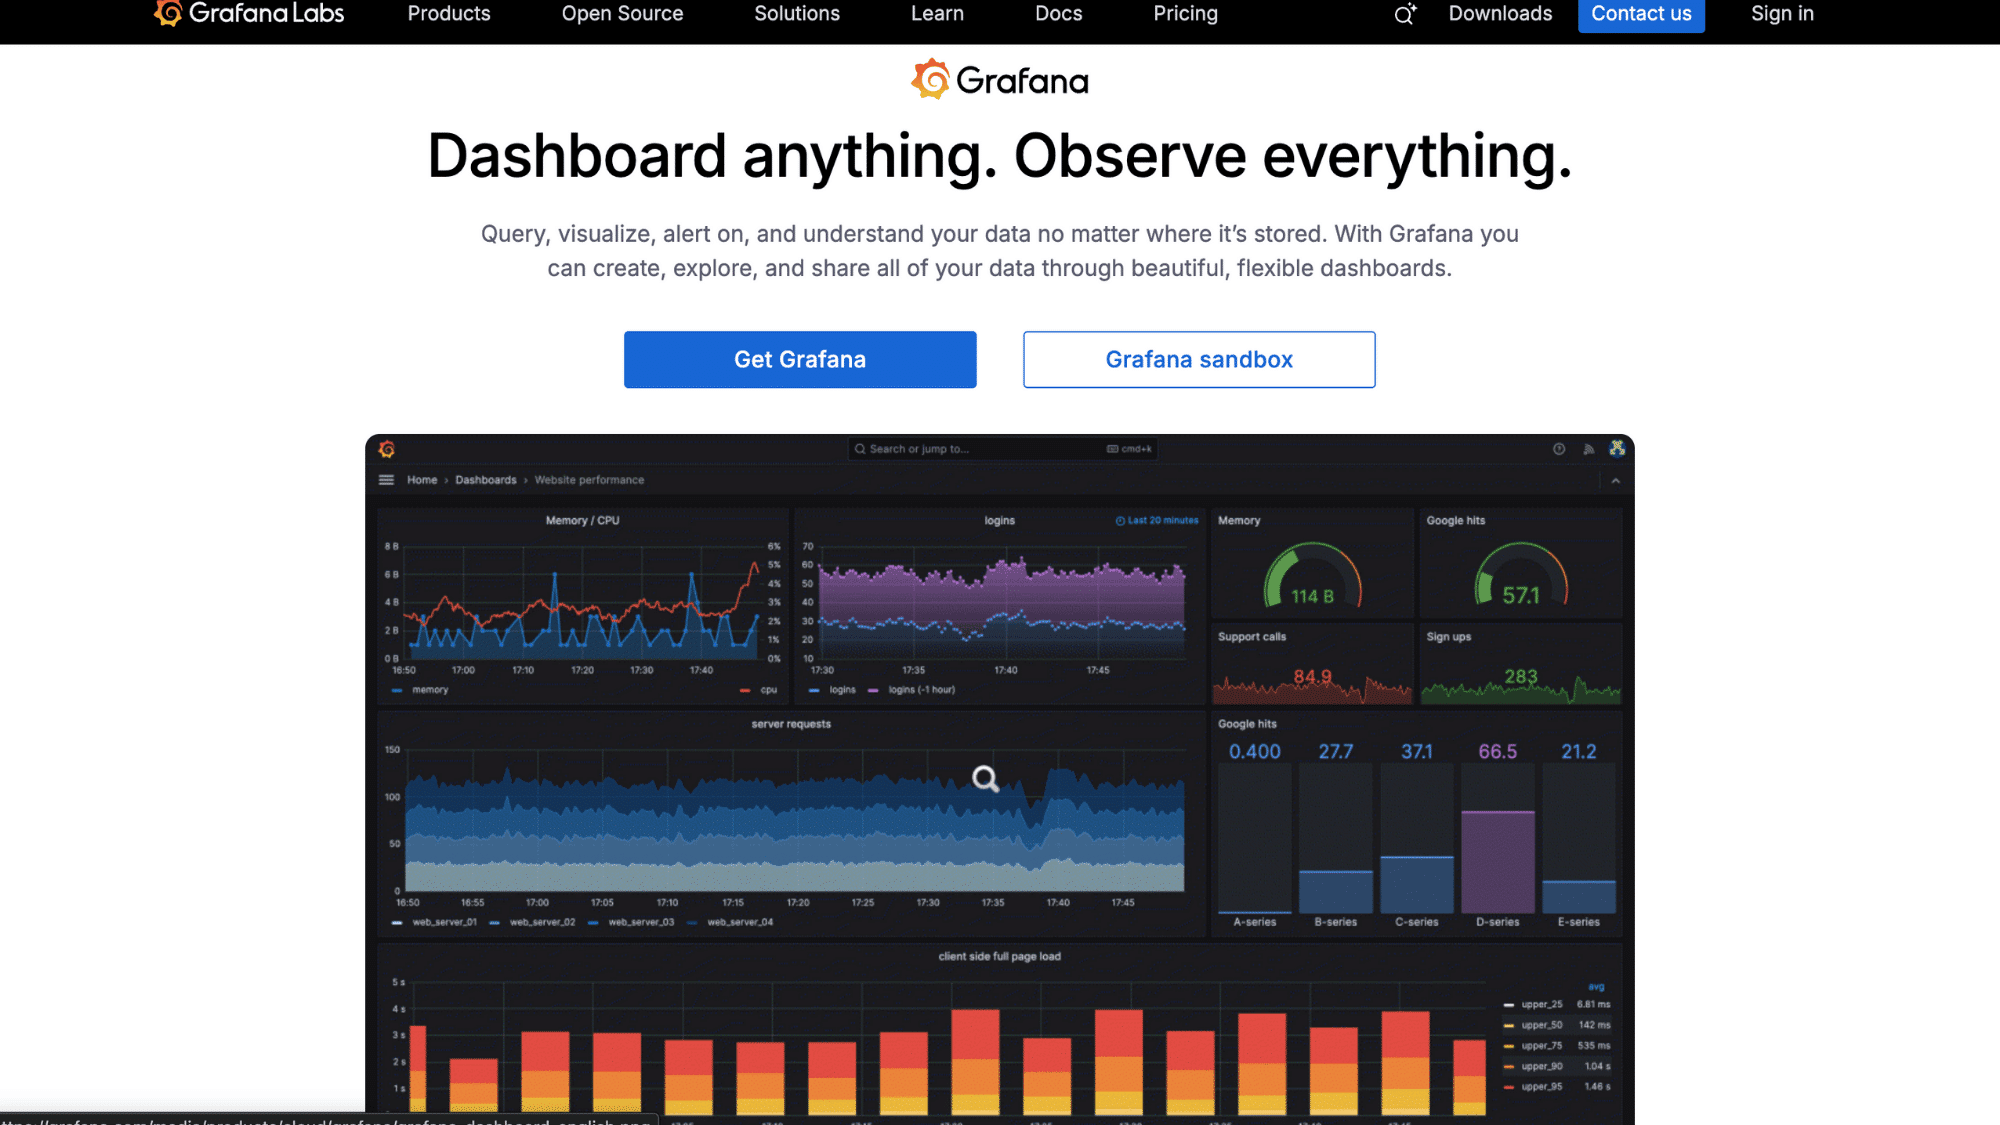
- Best for: Teams wanting beautiful, customizable dashboards to visualize metrics, logs, and traces from multiple sources
- Price: Free (open-source); Grafana Cloud has a free tier, paid plans start at $8/month
Grafana turns your monitoring data into gorgeous, real-time dashboards that actually make sense.
It connects to Prometheus, databases, cloud platforms, logs, pretty much any data source, and lets you build custom visualizations without coding.
Create dashboards showing server health, application performance, business metrics, whatever you need.
The drag-and-drop interface makes it accessible to non-technical team members, so everyone can see what’s happening with your systems.
| Pros | Cons |
|---|---|
| Stunning, highly customizable dashboards | Can become overwhelming with too many panels |
| Connects to dozens of data sources | Requires data sources to be already set up |
| Alerting is built in with multiple notification channels | Alert management is less classy than dedicated tools |
| Free tier is very generous | Performance can slow with complex queries |
20. Datadog
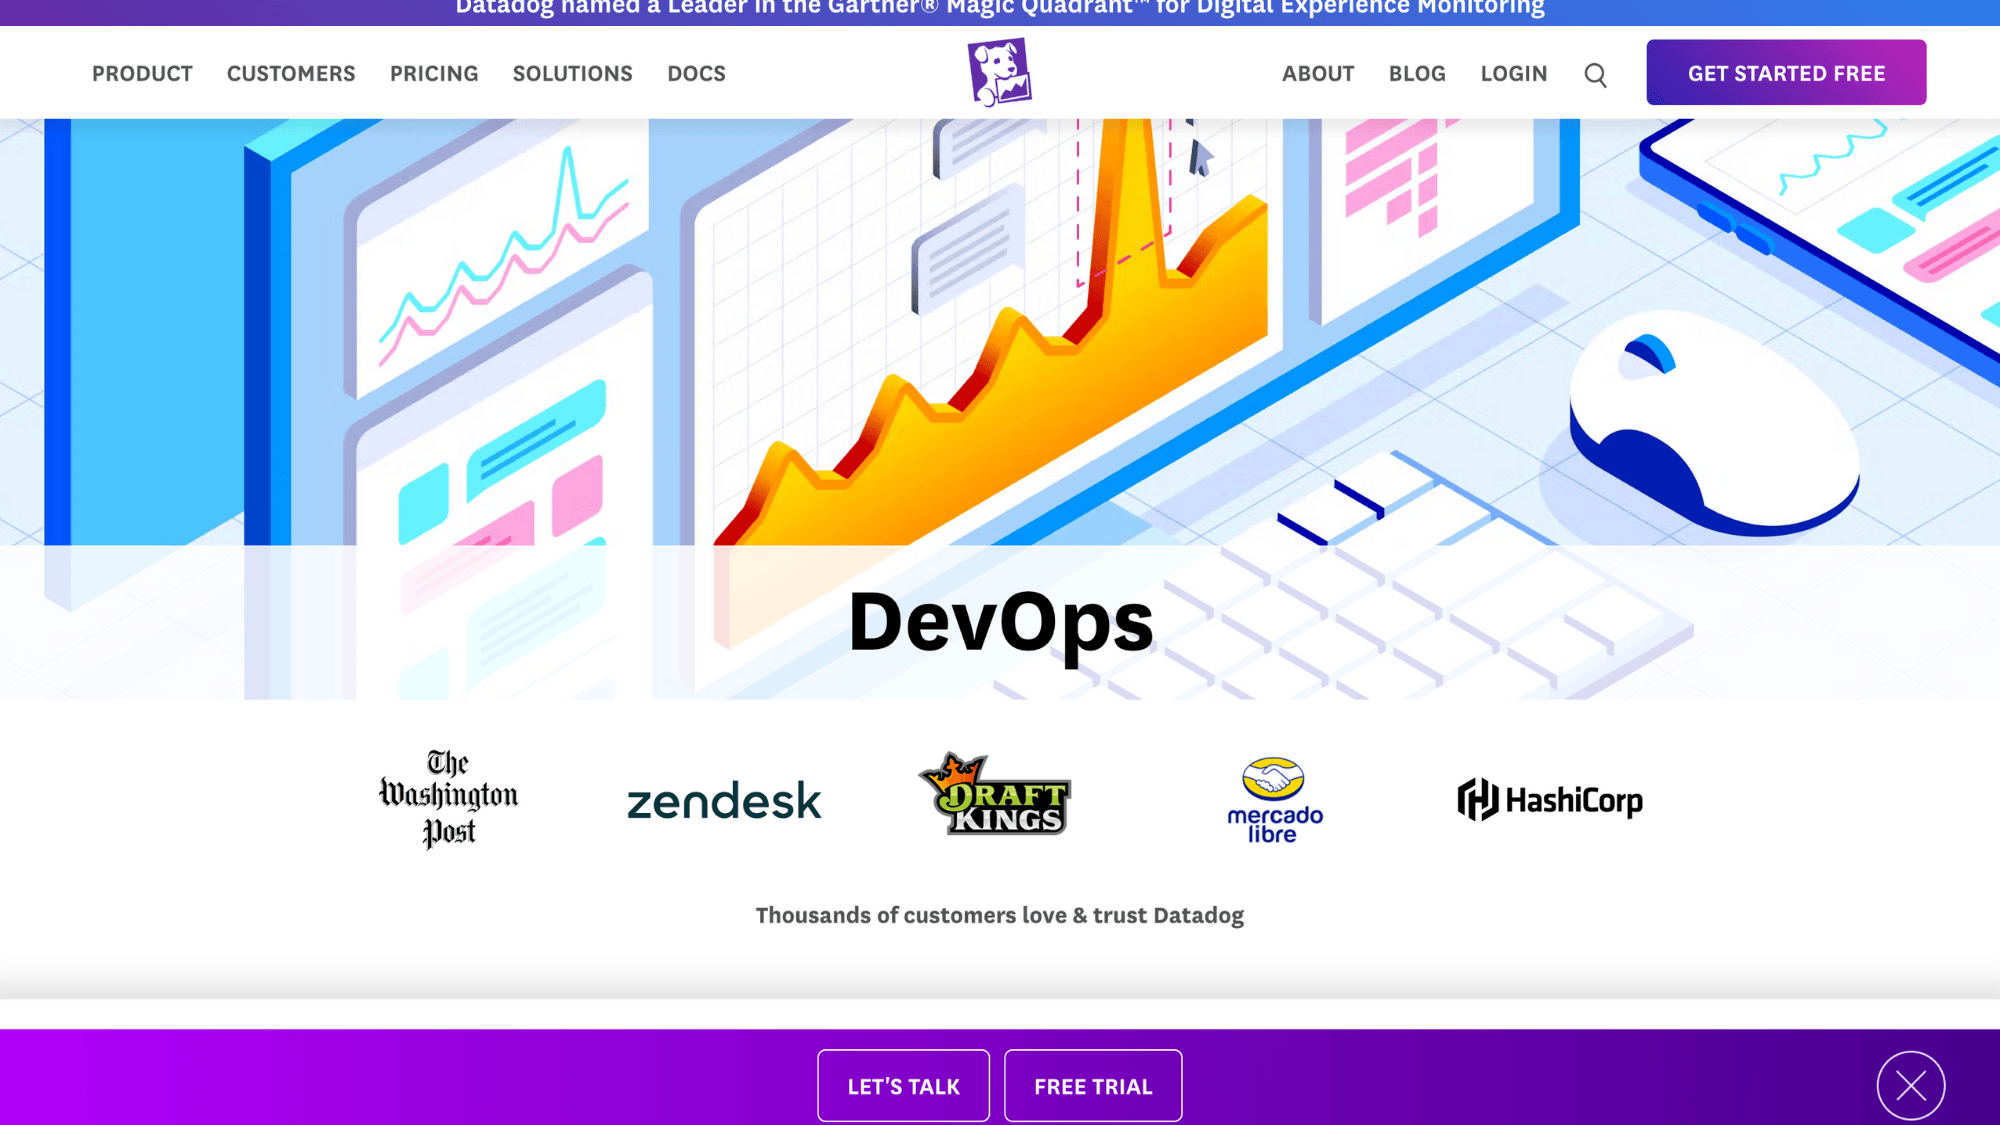
- Best for: Teams wanting an all-in-one commercial observability platform with minimal setup and excellent support
- Price: Starts at $15/host/month; pricing increases with features and data volume
Datadog is the Swiss Army knife of observability, monitoring, logs, traces, and security, all in one slick platform. Just install an agent, and it starts collecting data automatically.
You get pre-built dashboards for hundreds of technologies, intelligent alerting that reduces noise, and powerful analytics to find problems fast.
It’s pricey compared to open-source options, but you’re paying for simplicity, support, and not having to stitch together five different tools yourself.
| Pros | Cons |
|---|---|
| Comprehensive, everything in one platform | Gets expensive as you scale up |
| Minimal setup, works out of the box | Pricing can be unpredictable with usage spikes |
| Excellent integrations with 600+ technologies | Less customizable than open-source alternatives |
| Great support and documentation | Vendor lock-in, hard to migrate away |
21. Dynatrace
- Best for: Large enterprises needing AI-powered observability with automatic root cause analysis and deep application insights
- Price: Starts around $69/month for 8GB; enterprise pricing based on usage and features
Dynatrace uses AI to automatically understand your entire application stack, from user experience down to infrastructure, without manual configuration.
It discovers dependencies automatically, traces every transaction, and uses AI to pinpoint exactly what’s causing problems before you even notice. It’s enterprise-grade observability that handles massive, complex environments.
The AI-driven insights mean less time hunting for issues and more time fixing them. Premium pricing, but you get white-glove support and automation that saves engineering hours.
| Pros | Cons |
|---|---|
| AI automatically finds root causes, not just symptoms | Premium pricing is one of the most expensive options |
| Automatic discovery of all application dependencies | Can be overkill for smaller applications |
| Full-stack visibility from user to infrastructure | A steeper learning curve to use advanced features |
| Excellent for complex microservices environments | Requires commitment, not easy to trial properly |
22. New Relic
- Best for: Teams wanting user-friendly application performance monitoring with a strong focus on end-user experience
- Price: Free tier with 100GB data/month; paid plans start at $49/user/month
New Relic gives you clear visibility into how your applications perform from the user’s perspective. It tracks response times, error rates, and database queries and shows you exactly where slowdowns happen.
The interface is intuitive, and even non-technical stakeholders can understand the dashboards. You can trace a single user’s request through your entire system to find bottlenecks.
Great balance between power and usability, with a generous free tier for trying it out properly.
| Pros | Cons |
|---|---|
| Very user-friendly interface | Data retention limits on lower tiers |
| Strong application performance monitoring (APM) | Pricing complexity with multiple dimensions |
| Generous free tier for getting started | Some advanced features require higher-tier plans |
| Good mobile app monitoring capabilities | Less comprehensive than Dynatrace for huge enterprises |
23. Splunk
- Best for: Enterprises needing powerful log analysis, security monitoring, and compliance with massive data volumes
- Price: Starts around $150/GB/month ingested; enterprise pricing varies significantly
Splunk is the powerhouse for searching and analyzing machine data, logs, events, metrics, and everything. It ingests massive amounts of data and lets you search through it incredibly fast to find needles in haystacks.
Security teams love it for threat detection, ops teams use it for troubleshooting, and compliance teams rely on it for audit trails. The search language (SPL) is powerful once you learn it.
It’s expensive, but for organizations dealing with serious data volumes and security requirements, it’s often worth every penny.
| Pros | Cons |
|---|---|
| Incredibly powerful search and analysis capabilities | Very expensive, pricing based on data volume |
| Handles massive data volumes without breaking | Steep learning curve for advanced features |
| Excellent for security and compliance use cases | Resource-intensive infrastructure requirements |
| Mature ecosystem with lots of pre-built apps | Can get cost-prohibitive as data grows |
24. Elastic Stack (ELK)
- Best for: Teams wanting open-source log management and search with the flexibility to customize everything
- Price: Free (open-source); Elastic Cloud starts at $95/month for basic deployments
The Elastic Stack (Elasticsearch, Logstash, Kibana, formerly called ELK) gives you Splunk-like capabilities without the licensing costs.
Logstash collects and processes logs, Elasticsearch stores and indexes them lightning-fast, and Kibana provides dashboards and search interfaces.
It’s completely customizable and scales to handle huge log volumes. You’ll need technical skills to set it up and maintain it, but you avoid per-GB pricing and can run it anywhere you want.
| Pros | Cons |
|---|---|
| Open-source with no per-GB pricing | Requires expertise to set up and tune properly |
| Extremely flexible and customizable | Can be resource-hungry, needs careful sizing |
| Fast search across huge log volumes | Maintenance and upgrades take effort |
| Active community and good documentation | Licensing changes caused some community friction |
25. SonarQube
- Best for: Teams wanting automated code quality checks and security vulnerability scanning built into their pipelines
- Price: Free (Community Edition); Developer Edition starts at $150/year, pricing increases by edition
SonarQube scans your code every time you commit and flags bugs, security vulnerabilities, code smells, and technical debt before they reach production.
It supports 30+ programming languages and integrates right into your CI/CD pipeline. You get quality gates that can block merges if the code doesn’t meet your standards.
The dashboard shows exactly where your codebase needs attention. It’s like having an experienced code reviewer checking every line automatically, catching problems developers might miss.
| Pros | Cons |
|---|---|
| Catches bugs and vulnerabilities automatically | Community Edition lacks branch analysis |
| Supports most major programming languages | Can generate alert fatigue with default settings |
| Clear metrics on code quality over time | Requires tuning to match your team’s standards |
| Integrates smoothly with CI/CD pipelines | Enterprise features require paid editions |
How to Choose the Right DevOps Automation Tool
Picking the wrong tool wastes weeks of setup time and burns through the budget fast. Here’s how to choose smartly instead of guessing.
The 7-Point Checklist
Use these nine questions to evaluate any DevOps tool before committing:
1. Scalability – Will It Grow with You?
Check if the tool handles 10 servers as easily as 1,000. Ask: Does performance slow down as your team or infrastructure grows? Can it handle your busiest days without breaking? Look for real customer stories from companies of your size or bigger.
2. Integrations – Does It Play Nice with Your Current Stack?
List every tool your team uses daily, GitHub, Slack, AWS, whatever. Make sure your new tool connects to them without hacky workarounds. The fewer custom scripts you need to write, the better.
3. Ease of Use – Will Your Whole Team Actually Use It?
Download the tool or sign up for a trial. Can someone new figure it out in an hour? If the interface confuses your team during the demo, it’ll be worse in production. Good tools feel intuitive, not like solving a puzzle.
4. Cost – What’s the Real Price Tag?
Don’t just look at the advertised price. Add up hosting costs, training time, maintenance hours, and what happens when you scale up. Sometimes “free” tools cost more in engineering time than paid ones.
5. Security – Does It Protect Your Secrets and Meet Your Requirements?
Ask: How does it handle passwords and API keys? Does it support your authentication system (SSO, SAML)? If you’re in healthcare, finance, or government, verify it meets your compliance standards before going too far.
6. Support – Who Helps when Things Break at 2 Am?
Check what support comes free versus paid. Community forums are great until you have an emergency. If uptime matters, budget for support tiers that include actual humans who respond quickly.
7. Compliance – Does It Meet Your Industry Requirements?
If you need SOC 2, HIPAA, GDPR, or other certifications, verify them upfront. Migrating away from a non-compliant tool later is painful and expensive.
At the End
DevOps automation tools help teams work faster without adding chaos. The right setup can turn long deploy days into quick, repeatable releases, while also improving security, code quality, and uptime.
The key is matching tools to real needs: where code lives, how apps ship, which cloud is used, and how much time the team can spend on setup and upkeep.
Start small, automate one painful workflow, and build from there. With a smart stack, releases feel smoother, rollbacks get easier, and late-night fire drills happen less often.
Ready to build a tool stack that fits the team? Pick 2–3 tools from the checklist and start a trial this week.